How Financial Dashboards Help Business Owners Monitor Performance
Business owners rarely have time to work through pages of financial reports every week.
Yet important questions still need answers:
Want expert help? Daintree Consulting's accounting services can take this off your plate. Book a free consultation.
Is the business making enough profit?
Is cash flow heading in the right direction?
Are sales growing as expected?
Which costs are increasing?
Are customers paying on time?
Is the business on track against its budget?
Are there financial issues that need attention now rather than next quarter?
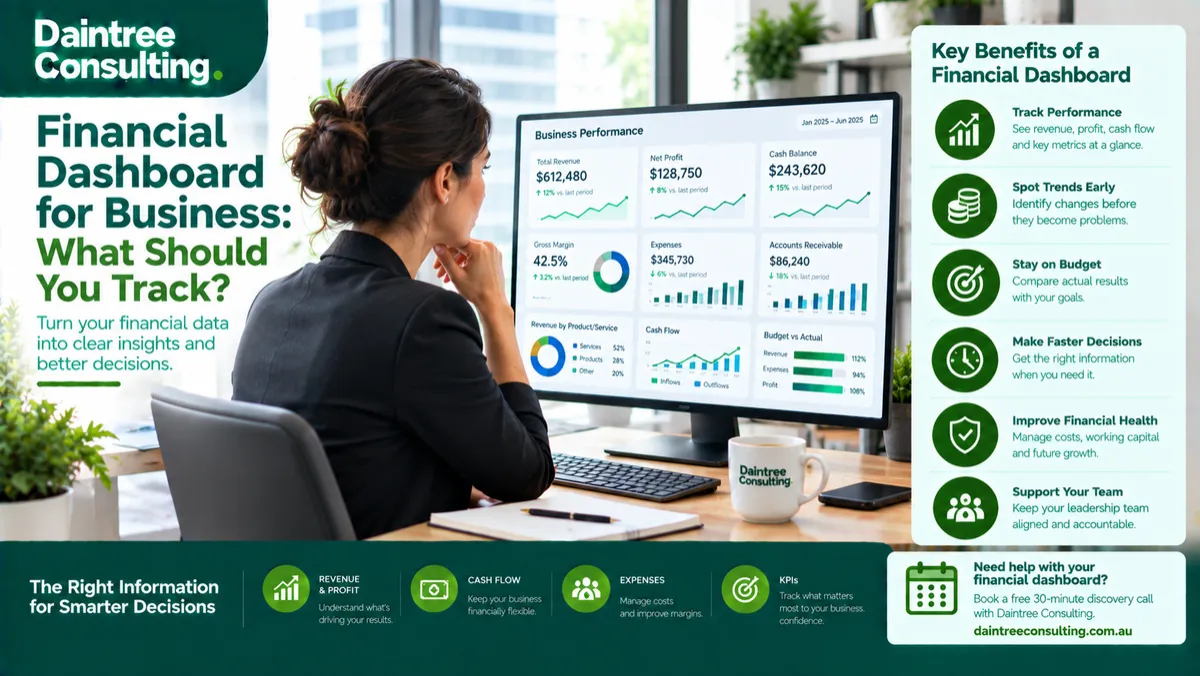
A financial dashboard for business can bring these numbers together in one practical view.
Instead of searching through separate reports, spreadsheets and accounting records, a dashboard can give business owners a clearer picture of what is happening financially and where further investigation may be needed.
The value is not simply having attractive charts on a screen. A useful financial dashboard should help turn accounting data into information that supports better business decisions.
Quick answer: What is a financial dashboard for a business?
A financial dashboard is a visual reporting tool that brings important financial and performance measures together in one place.
Depending on the business, a dashboard may show:
Revenue
Gross profit and gross margin
Operating expenses
Net profit
Cash balance
Cash flow
Accounts receivable
Accounts payable
Budget versus actual results
Key business KPIs
Working capital
Financial trends
Forecast information
The specific metrics should depend on what the business needs to monitor.
A small service business may need a different dashboard from a construction company, retailer or professional services firm.
The objective is to make important financial information easier to understand, review and act on.
Why do business owners need a financial dashboard?
Accounting systems contain a large amount of information.
The challenge is often not a lack of data. It is knowing which information matters and how to interpret it.
A business owner may have access to:
Profit and loss reports
Balance sheets
Bank transactions
Sales reports
Payroll information
Debtor reports
Supplier balances
Tax records
Budget spreadsheets
Accounting software reports
But having all this information does not necessarily mean the owner has a clear view of business performance.
A financial dashboard can bring selected information together so the owner can quickly identify what has changed.
For example, revenue might be increasing while gross margin is falling.
A sales report alone could make the business appear to be growing. A dashboard showing revenue alongside gross margin could highlight that the additional sales are not producing the expected level of profit.
That difference can lead to a much more useful question:
Why are we selling more but retaining less profit?
That is where financial reporting becomes a decision-making tool rather than simply a record of what has already happened.
What should a financial dashboard include?
There is no single dashboard that works for every business.
The right structure depends on the business model, size, financial priorities and decisions the owner needs to make.
However, several areas are commonly useful.
1. Revenue
Revenue is one of the most obvious measures to monitor.
A dashboard might show:
Current-period revenue
Year-to-date revenue
Revenue compared with budget
Revenue compared with the previous period
Revenue by business unit
Revenue by product or service
Revenue by location
Revenue by customer group
Looking at revenue over time can help identify whether growth is consistent or concentrated in particular periods.
However, revenue should rarely be considered on its own.
Higher sales do not automatically mean higher profitability or stronger cash flow.
2. Gross profit and gross margin
Gross profit shows what remains after the direct costs associated with generating revenue.
Gross margin expresses this as a percentage.
Monitoring gross margin can help identify changes that may otherwise be hidden by revenue growth.
For example, a business could report stronger sales but experience:
Higher supplier costs
Increased subcontractor costs
Pricing pressure
Discounting
Changes in product mix
Lower-margin contracts
A dashboard can make these changes easier to spot.
3. Operating expenses
A financial dashboard can also track major operating expenses.
Depending on the business, this could include:
Wages and salaries
Rent
Software
Marketing
Insurance
Professional fees
Vehicle costs
Utilities
Administration
The objective is not necessarily to monitor every expense individually.
Instead, the dashboard should help identify meaningful movements.
If a particular expense category has increased substantially compared with the budget or previous periods, the owner can investigate the reason.
4. Net profit
Revenue and gross margin tell only part of the story.
Business owners also need visibility over what remains after operating expenses.
A dashboard may show:
Net profit for the current month
Year-to-date net profit
Net profit margin
Budget versus actual profit
Previous-period comparisons
Forecast profit
This provides a broader view of whether business growth is translating into financial performance.
5. Cash position
Profit and cash are not the same thing.
A business can report a profit while experiencing pressure on its bank balance.
A financial dashboard can therefore include:
Current cash balance
Cash movement
Expected receipts
Upcoming payments
Cash-flow trends
Short-term cash requirements
This can help owners identify potential cash pressure before it becomes an immediate problem.
For businesses with significant working-capital requirements, cash visibility can be particularly important.
6. Accounts receivable
Money owed by customers can have a significant impact on cash flow.
A dashboard might monitor:
Total accounts receivable
Current receivables
Overdue amounts
Ageing categories
Significant outstanding customers
Changes in debtor balances
If sales are growing but receivables are growing even faster, the business owner may need to investigate collection processes and customer payment behaviour.
This is one example of how a dashboard can connect accounting information with an operational issue.
7. Accounts payable
Supplier obligations are another important part of the financial picture.
A dashboard may track:
Total accounts payable
Upcoming supplier payments
Overdue balances
Major supplier obligations
Changes in creditor balances
When viewed alongside cash-flow information, accounts payable can help business owners understand upcoming financial commitments.
8. Budget versus actual performance
A dashboard becomes considerably more useful when it compares actual results with expectations.
For example, it may show:
Revenue: below budget
Gross margin: above budget
Marketing expense: above budget
Net profit: below budget
The purpose is not simply to identify that something is different.
The next question is:
Why?
A variance could be caused by timing, a change in sales volume, pricing, unexpected costs, an accounting adjustment or an underlying business problem.
The dashboard highlights the area that deserves attention. Further analysis explains what is actually happening.
9. Key performance indicators
Financial dashboards can also incorporate selected business KPIs.
The appropriate KPIs depend on the business.
Examples could include:
Revenue per customer
Average transaction value
Gross margin
Customer acquisition cost
Debtor days
Recurring revenue
Labour utilisation
Project profitability
Stock turnover
Working capital measures
Not every business needs all of these.
A dashboard with too many metrics can become difficult to use.
The better approach is to identify the numbers that genuinely influence business performance.
Financial dashboards should focus on trends, not isolated numbers
One of the biggest advantages of a dashboard is the ability to see movement over time.
A single month's revenue figure tells you relatively little.
A trend can tell you much more.
For example, imagine a business has experienced:
Revenue increasing for six months
Gross margin gradually declining
Accounts receivable increasing
Cash reserves decreasing
Each individual number might not immediately appear alarming.
Viewed together, however, they tell a much clearer story.
The business may be growing while requiring more cash to support that growth and generating less gross profit from each dollar of revenue.
That is a much more useful insight for an owner than simply knowing the monthly sales figure.
A financial dashboard can help identify problems earlier
Financial reporting is often most valuable when it helps identify an issue before it becomes a larger problem.
A dashboard can create regular visibility over changes such as:
Falling margins
Increasing expenses
Slowing customer payments
Declining cash reserves
Budget overruns
Weak sales growth
Increasing debt
Changes in working capital
Underperforming business areas
The dashboard itself does not solve these issues.
Instead, it provides an early signal that further investigation may be required.
That distinction matters.
A dashboard is a monitoring and decision-support tool, not a substitute for financial analysis.
How often should a business review its financial dashboard?
The appropriate review frequency depends on the business.
Some businesses may benefit from weekly monitoring of selected measures, particularly cash and sales.
Others may have a more meaningful monthly review cycle.
A practical monthly dashboard review could involve:
Reviewing the latest financial results.
Comparing actual performance with budget.
Identifying significant movements.
Reviewing cash and working capital.
Checking important KPIs.
Investigating unusual variances.
Updating forecasts where appropriate.
Agreeing on actions.
Assigning responsibility for those actions.
Reviewing progress during the next reporting cycle.
The important part is consistency.
A dashboard that is created once and then ignored will not improve financial visibility.
What is the difference between a financial dashboard and financial reports?
Financial reports and dashboards serve related but different purposes.
Financial statements and management reports provide detailed financial information.
A dashboard typically provides a more condensed visual view of selected information.
For example, a monthly management accounts pack might contain detailed:
Profit and loss information
Balance sheet information
Cash-flow information
Variance analysis
Supporting schedules
A dashboard could then present the most important measures from that information in a format designed for quick review.
The two can work together.
The dashboard can help the owner identify where attention is required, while the underlying reports provide the detail needed to understand the issue.
Financial dashboards need reliable accounting data
A dashboard can only be as reliable as the information behind it.
If the accounting records contain errors, missing transactions or unreconciled balances, the dashboard may present an inaccurate picture.
This is why good dashboard reporting usually starts with good financial records.
Businesses should have appropriate processes for:
Bank reconciliations
Accounts receivable
Accounts payable
Payroll
GST and tax-related records
Expense recording
Fixed assets
Revenue recognition where applicable
Month-end adjustments
Balance sheet reconciliations
Reliable source data gives management reporting a much stronger foundation.
If the numbers are not trustworthy, adding more visualisation will not fix the underlying problem.
How to build a useful financial dashboard
A practical approach is to start with business decisions rather than software features.
Step 1: Identify the decisions you need to make
Ask what questions the dashboard should help answer.
For example:
Are we profitable?
Are we generating enough cash?
Are we on budget?
Which services are most profitable?
Are customers paying on time?
Can we afford planned growth?
Are expenses increasing too quickly?
These questions should influence the dashboard design.
Step 2: Select the most relevant metrics
Choose measures that directly relate to those questions.
Avoid adding metrics simply because the accounting software can produce them.
Step 3: Establish reliable data
Check that the underlying accounting records are complete, reconciled and appropriately classified.
Step 4: Set useful comparison points
Numbers become more meaningful when compared with something.
Possible comparisons include:
Previous month
Same period last year
Budget
Forecast
Target
Prior quarter
Step 5: Decide who will use the dashboard
An owner may need a high-level view.
A finance manager may require more detailed information.
An operations manager may need different KPIs again.
The dashboard should match the person using it.
Step 6: Establish a review routine
Decide when the dashboard will be reviewed and who is responsible for following up significant changes.
Step 7: Keep improving it
As the business changes, the dashboard should change with it.
A metric that mattered when the business had five employees may be less useful after the company expands into new markets or introduces new services.
Common financial dashboard mistakes
Including too many metrics
More information does not necessarily mean better information.
A crowded dashboard can make it harder to identify what actually matters.
Focusing only on revenue
Sales growth is important, but revenue does not show the complete financial position of a business.
Ignoring cash flow
Profitability without cash visibility can leave an owner exposed to unexpected payment pressure.
Using unreliable data
A dashboard should not be treated as reliable if the accounting records behind it have not been properly reviewed.
Looking at numbers without context
A variance is a signal, not necessarily a problem.
An expense may be above budget because an annual insurance payment occurred during the month. Context matters.
Failing to take action
The purpose of monitoring performance is ultimately to support better decisions.
If a dashboard repeatedly identifies the same issue but nobody investigates it, the reporting process is not delivering its full value.
When does a business need a financial dashboard?
A financial dashboard can be useful at many stages of business growth.
It may become particularly valuable when:
The business has grown beyond the owner's direct oversight
There are multiple revenue streams
The business has several locations
The owner is managing a growing team
Cash flow has become more difficult to predict
Financial reports are becoming harder to interpret
Management wants more regular performance visibility
Budgeting and forecasting are becoming more important
The business is preparing for growth
Multiple people are making financial decisions
The need is not necessarily determined by revenue or employee numbers.
It is more closely related to the complexity of the decisions the business needs to make.
How Daintree Consulting can help
A financial dashboard is most useful when it reflects the numbers and decisions that matter to your business.
Daintree Consulting helps Australian businesses improve financial visibility through connected accounting, management reporting and financial oversight.
Depending on your requirements, this can include management accounts, budget-to-actual reporting, cash-flow reporting, financial dashboards and ongoing review of financial information.
The goal is not to give you another report to read.
It is to help you understand what the numbers are telling you and identify where further attention may be needed.
If your current financial reporting makes it difficult to see how your business is performing, explore Daintree Consulting's Accounting Services or book a free 30-minute discovery call to discuss your requirements.
Frequently Asked Questions
What is a financial dashboard for business?
A financial dashboard is a visual reporting tool that brings important financial measures into one place. It can include revenue, profit, cash flow, expenses, receivables, payables, budget variances and selected business KPIs.
What should a small business financial dashboard include?
A small business dashboard might include revenue, gross margin, operating expenses, net profit, cash position, accounts receivable, accounts payable and budget-versus-actual results. The right metrics depend on the business.
How often should I review my financial dashboard?
Many businesses can benefit from a monthly financial performance review, while certain measures such as sales and cash may warrant more frequent monitoring. The appropriate frequency depends on the business and its financial risks.
Is a financial dashboard the same as a profit and loss report?
No. A profit and loss report provides detailed information about revenue, expenses and profit. A dashboard can present selected financial and business measures in a condensed visual format, often alongside comparisons and trends.
Can a financial dashboard improve business performance?
A dashboard does not improve performance by itself. Its value is in making important financial information easier to monitor and helping business owners identify trends, variances and areas that may require action.
What if my accounting records are not accurate?
The underlying accounting records should be reviewed and reconciled before relying heavily on dashboard reporting. A dashboard built from incomplete or inaccurate data can give management a misleading picture.
Can a financial dashboard include cash-flow information?
Yes. Cash balance, cash movements, expected receipts, upcoming payments and other cash-flow measures can be incorporated depending on the reporting requirements of the business.
Does every business need the same financial dashboard?
No. The most useful dashboard depends on the business model, financial priorities, reporting requirements and decisions the owner or leadership team needs to make.
Final takeaway
A financial dashboard for business can make financial performance easier to monitor by bringing important numbers, trends and comparisons into one practical view.
The most useful dashboards do more than display revenue and profit.
They help business owners see relationships between:
Sales and profitability
Profit and cash flow
Revenue and margins
Customers and receivables
Expenses and budgets
Growth and working capital
The dashboard should also be supported by accurate accounting records and a regular review process.
When the right information is presented clearly and consistently, business owners have a stronger foundation for asking better questions, investigating financial changes and making informed decisions.
If you want clearer visibility over your business finances, book a free 30-minute discovery call with Daintree Consulting to discuss how accounting and management reporting can support your business.
Talk to Daintree about your accounting
Our ex-Big 4 team gives clear, senior-reviewed advice so you can act with confidence.
Book a free consultation →
Or explore our accounting services.
